Results and display guide
The review report presents 5 planned main manuscript displays. Supporting
diagnostics and robustness analyses remain supplementary. Aggregate results are
visible for independent statistical review. They are not authorized for
manuscript import while results_authorized=false remains binding.
Main result
Direct tract and community-area labels did not produce identical geographic descriptions.
| Condition | Eligible tracts | Quartile disagreement | Within-community variance share | Q4 movers |
|---|---|---|---|---|
| Hypertension | 722 | 255 (35.3%) | 0.195 | 76 (10.5%) |
| COPD | 411 | 206 (50.1%) | 0.469 | 101 (24.6%) |
These findings indicate that tract-level Chicago Health Map measures retained clinically observed small-area variation that a single direct community-area label did not fully convey. They do not estimate population prevalence or the effect of geography on disease.
Figure 1: data flow, coverage, and suppression
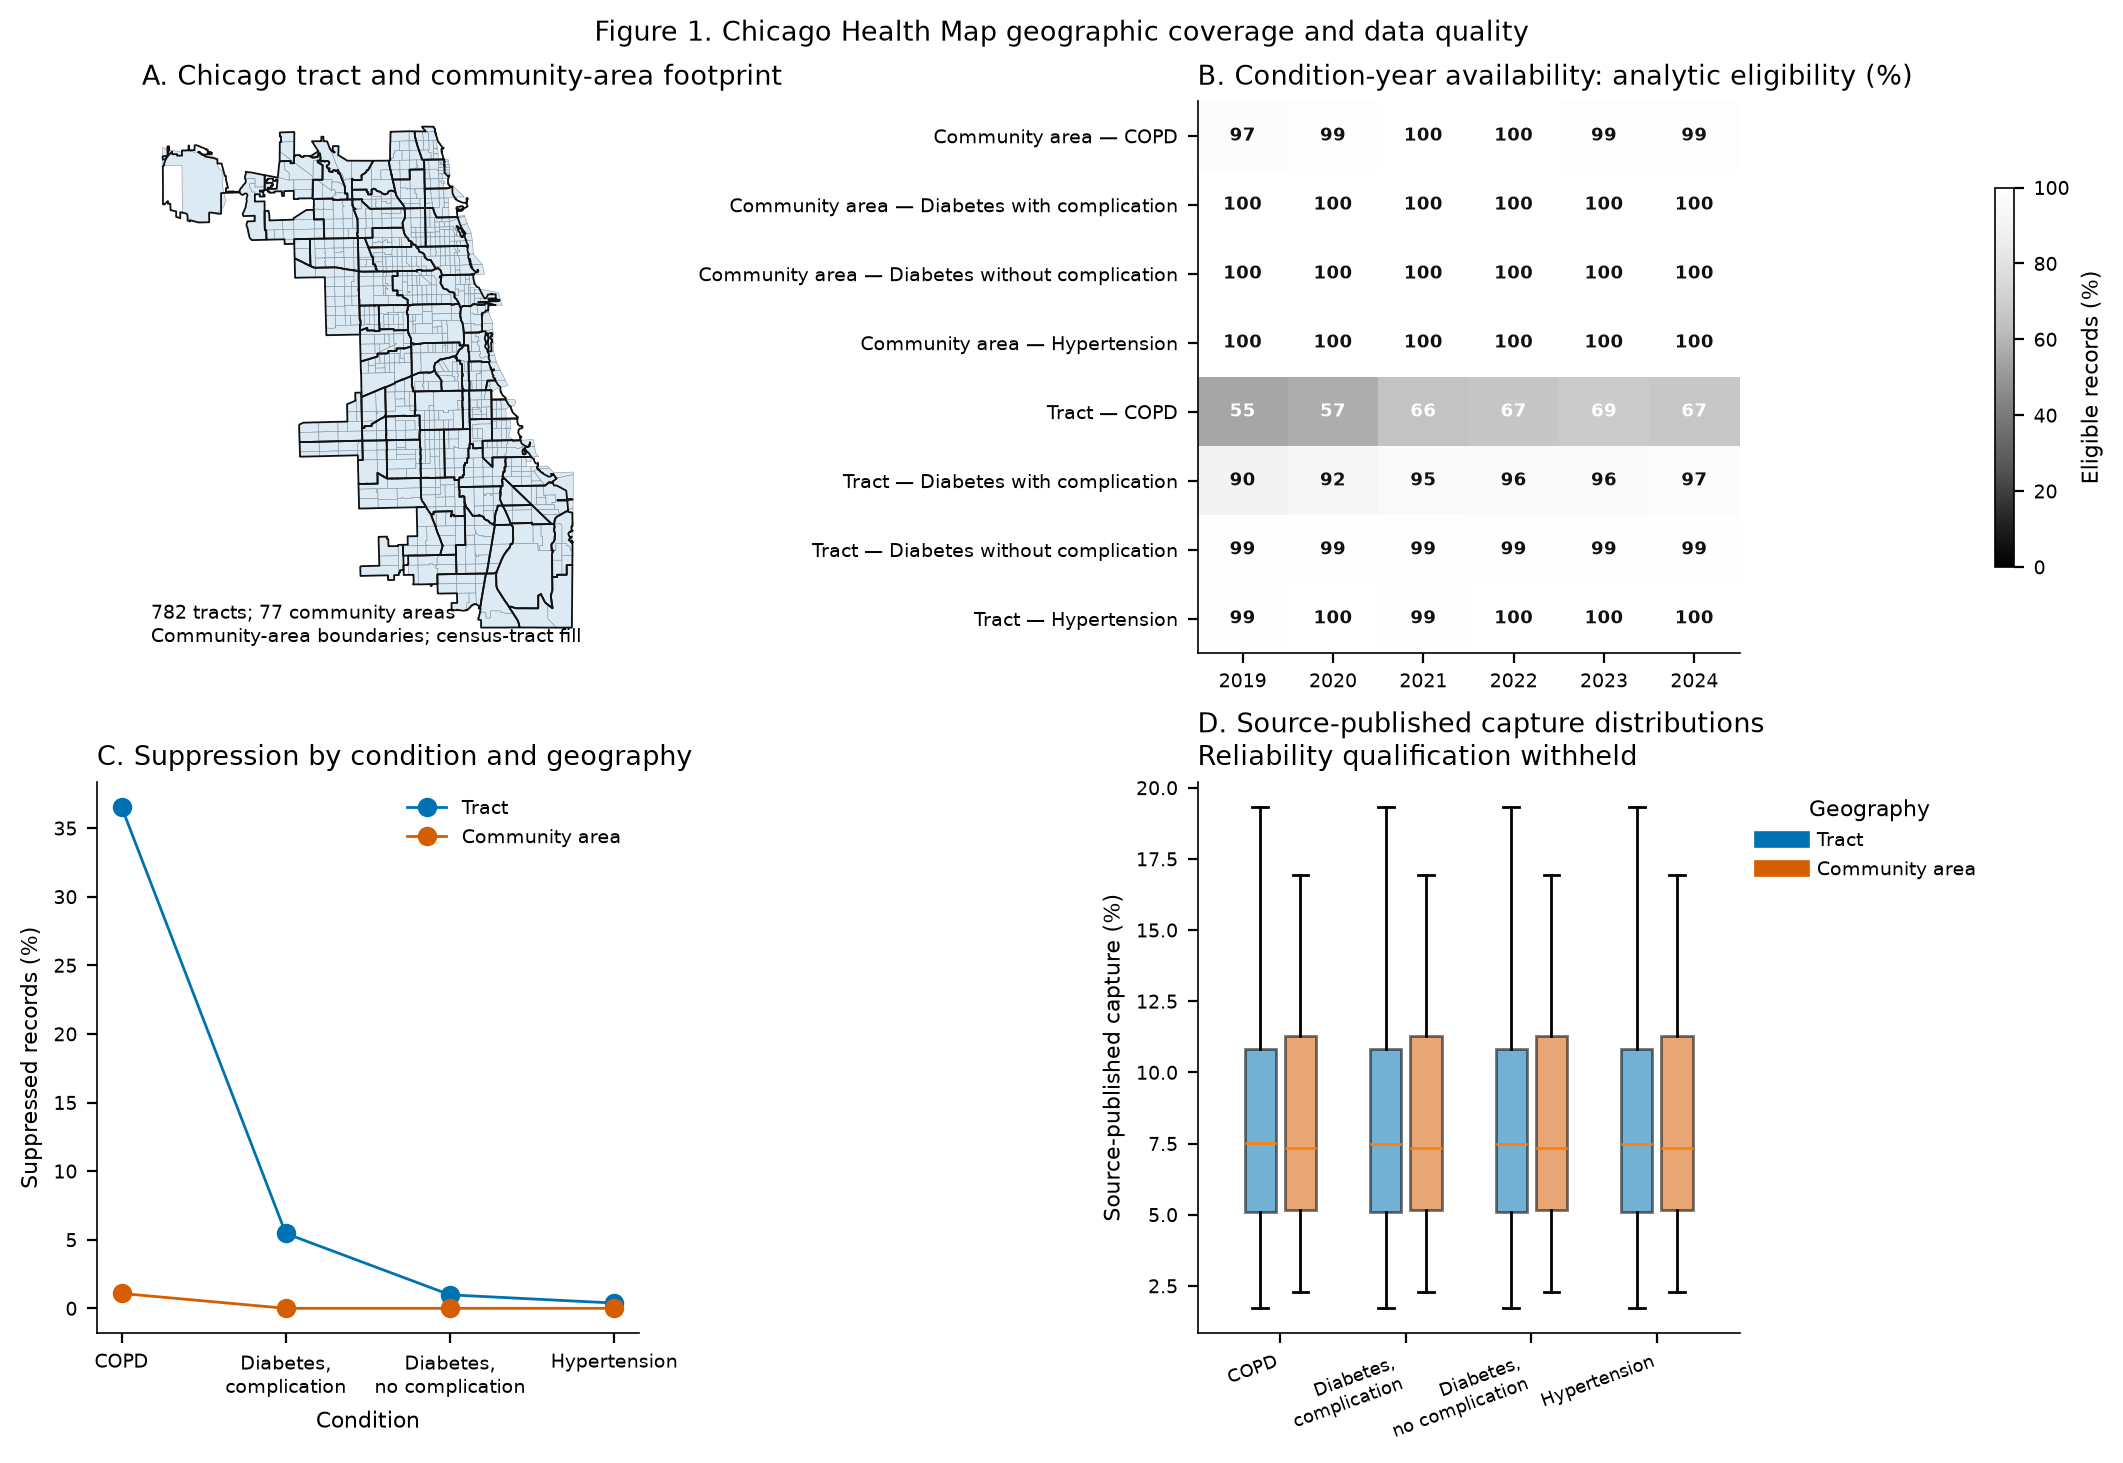
Purpose: show which geographic records were available and how suppression changed the analytic populations.
Limitation: availability does not establish representativeness. Capture is metadata, not a sampling probability.
Figure 2: cardiometabolic geographic patterns
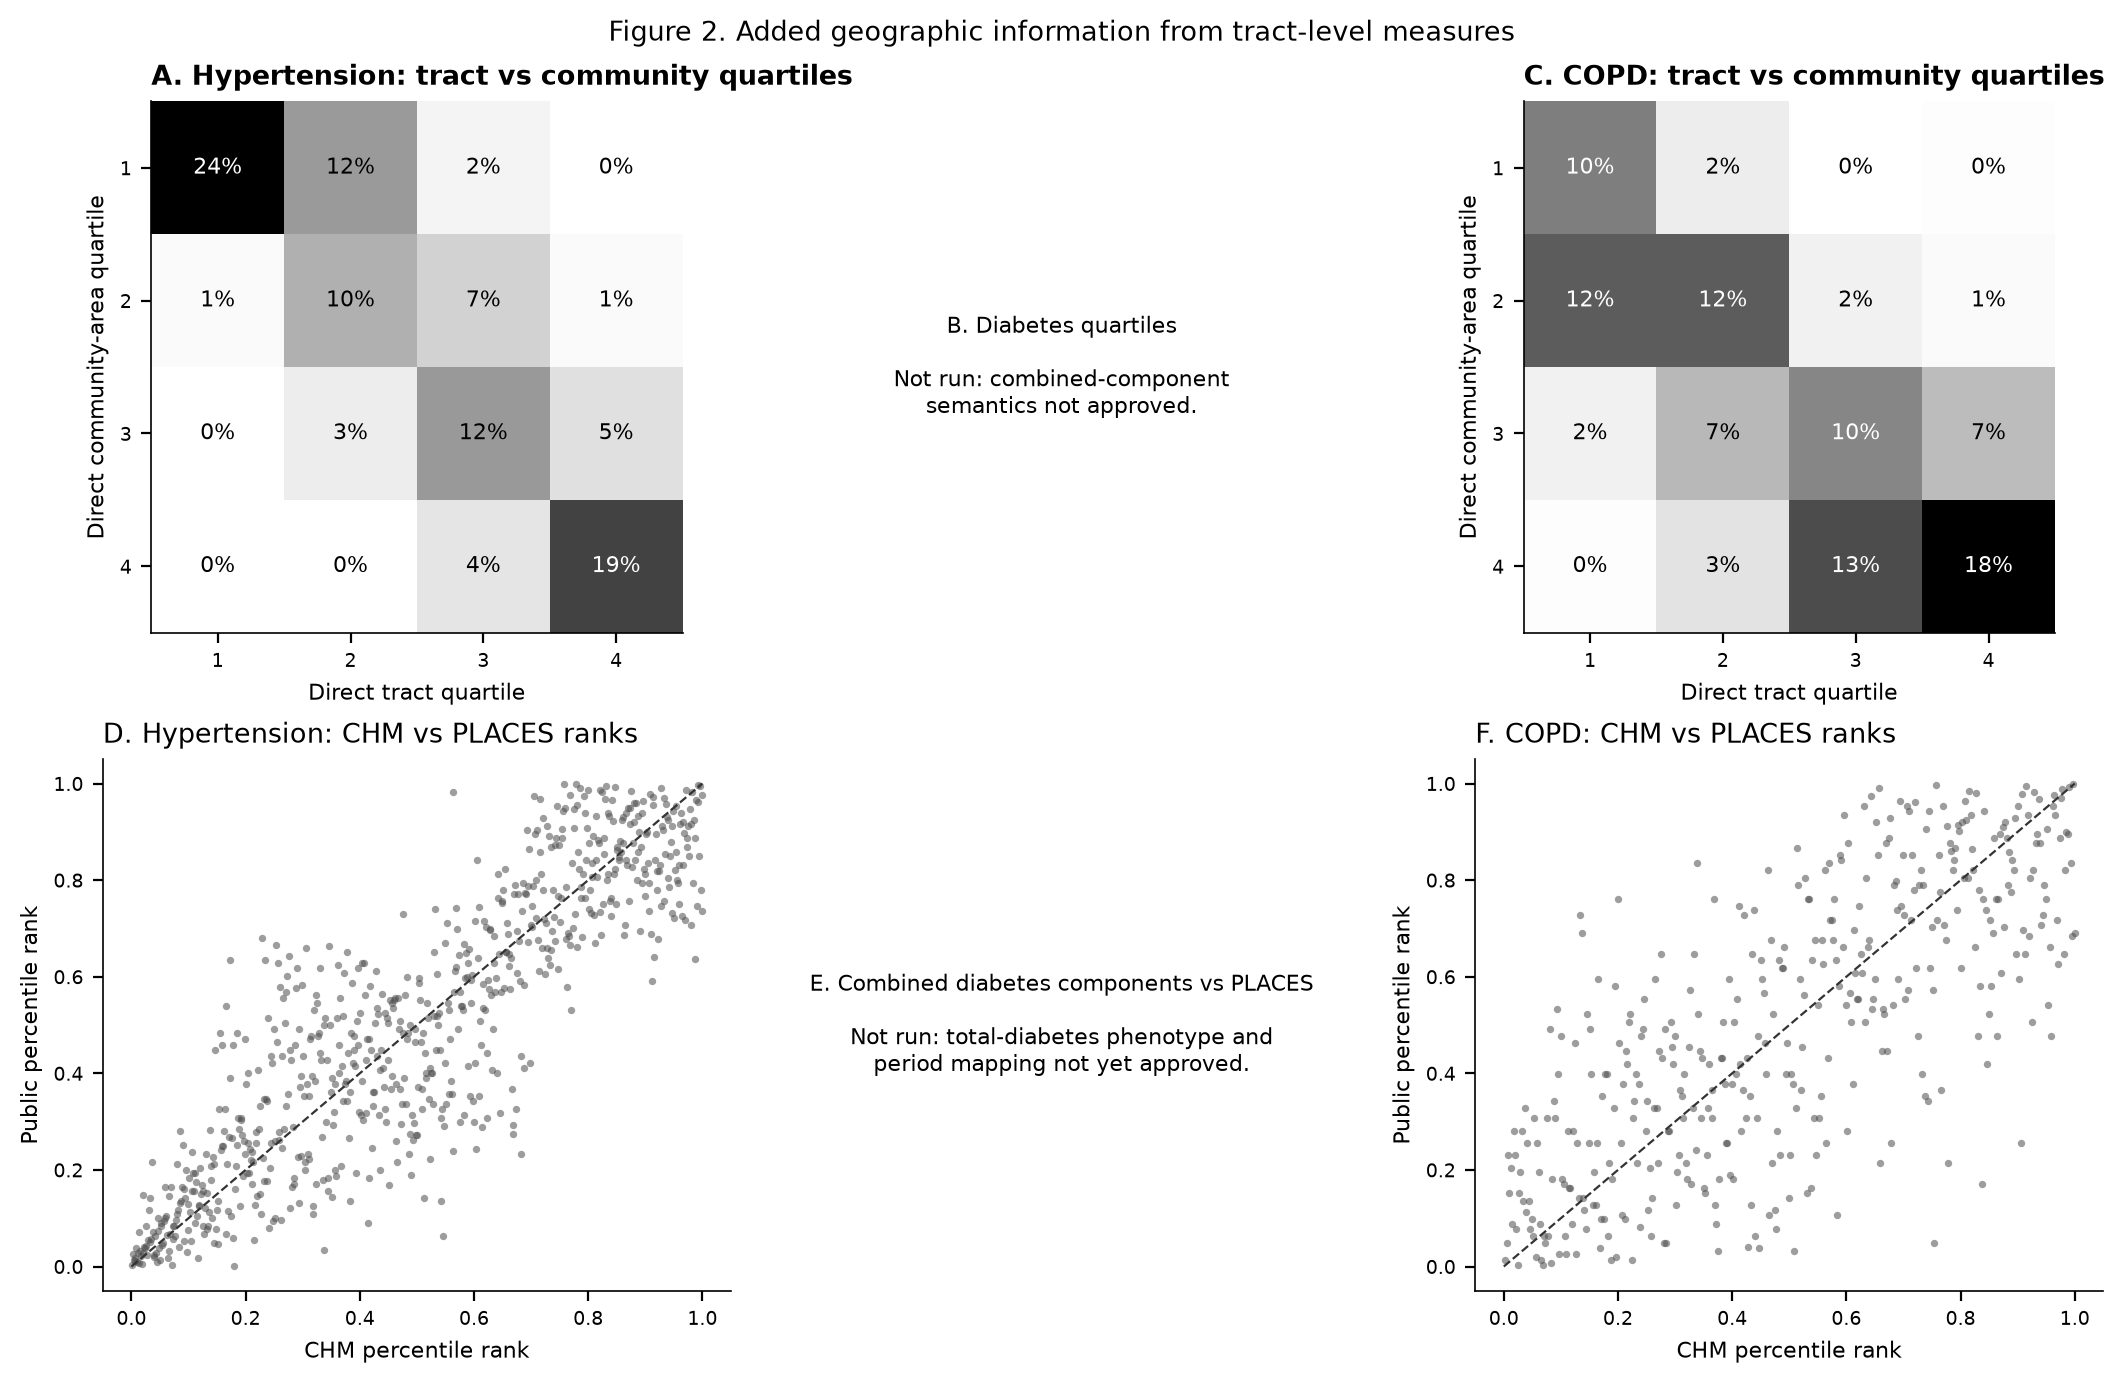
Purpose: display tract and coarser-area classification patterns for the cardiometabolic analyses that passed their data requirements.
Limitation: combined diabetes was excluded. Separate diabetes components were not added together.
Figure 3: COPD geographic patterns
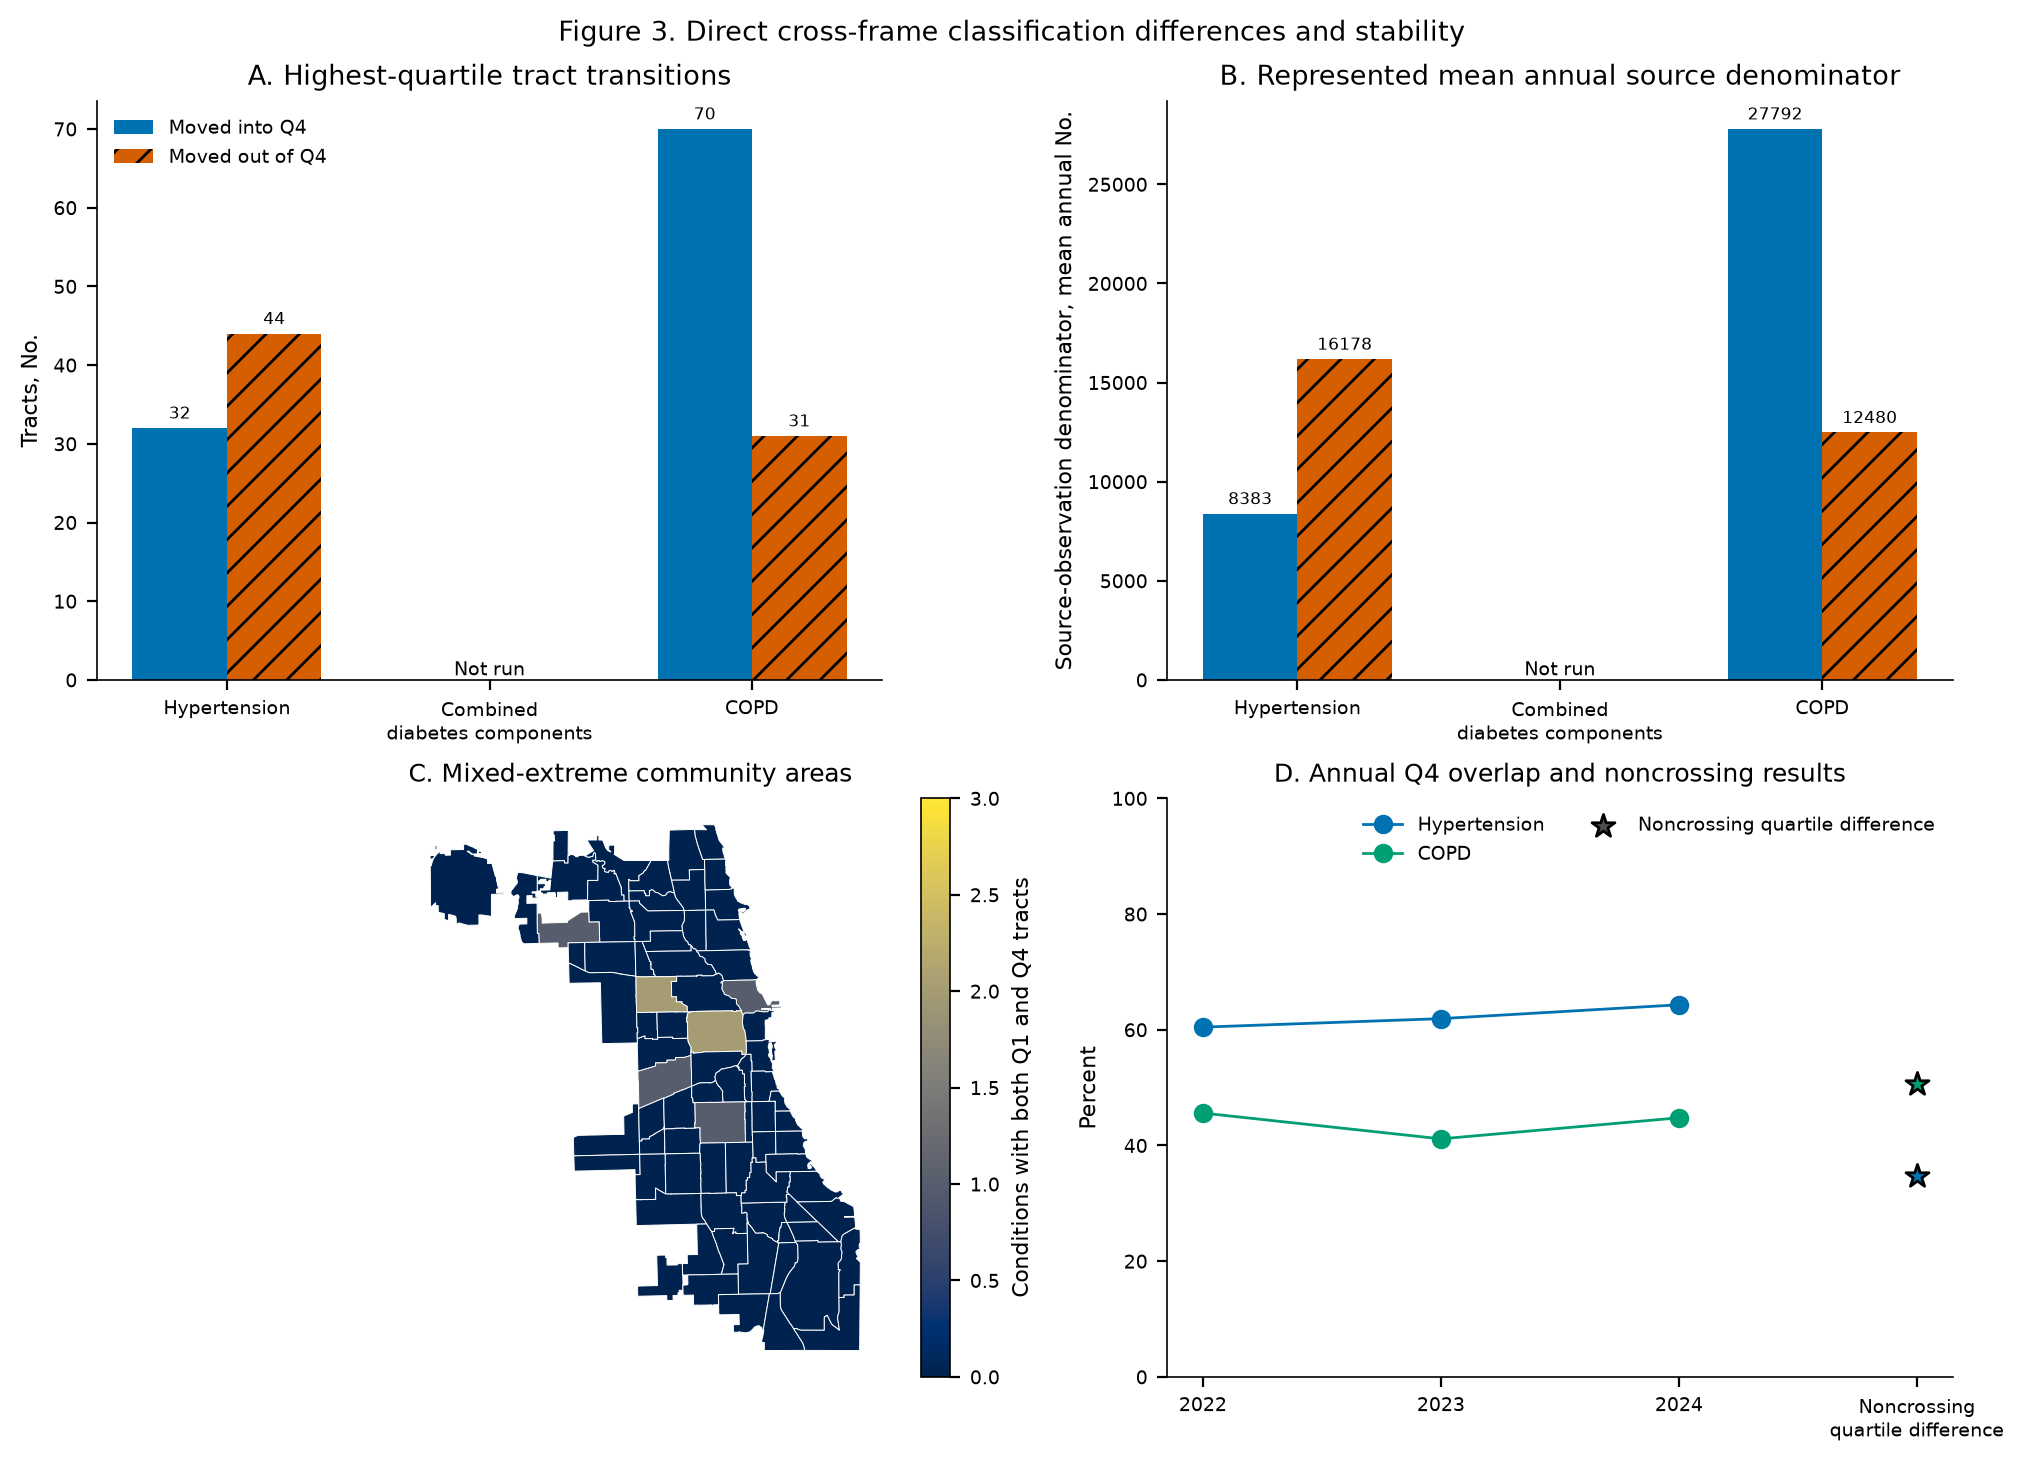
Purpose: show the condition with the larger observed within-community variance share and greater quartile movement.
Limitation: COPD eligibility was lower because unresolved zero or suppressed records were more frequent. The result is conditional on the eligible frame.
Table 1: resource quality
Table 1 reports condition-year record counts, represented community areas, source denominators, eligibility, suppression, capture, and reliability classification status. Counts refer to aggregate records, not unique people.
Table 2: geographic-resolution evidence
Table 2 presents the primary tract-community comparison for hypertension and COPD. It reports the eligible denominator beside each percentage. Diabetes is shown as not analyzed because the required source semantics were unavailable.
Supplementary interpretation
Cluster-bootstrap intervals quantify sampling variation under community-area resampling. The HCS analysis provides independent local rank triangulation. The life-expectancy and spatial models remain supplementary because they are ecological, contain at most 77 areas, and do not test the primary resolution estimand.